
This is the first in a series of posts where I’ll be walking through setting up and experimenting with Splunk Enterprise 10 and some of its premium apps. Since this is (mostly) a test environment, I’m running everything on a single consolidated instance. In this article, I’ll cover setting up the deployment server and installing the Add-on for Unix and Linux.
Disclaimer: Even though I work at Splunk, this is a personal project. Everything here reflects my own opinions and tinkering—not official, semi-official, or even necessarily good advice. I’ll reference official docs at times, but I’ll also go off-script. Proceed with caution.
Install and Configure the App
I’m starting a little backwards, but it’ll make sense. First, I created two indexes for system data—mainly to keep things tidy:
systems-> Events Indexsystems_metrics-> Metrics Index
With that done, I downloaded and installed the Unix/Linux app from Splunkbase and installed it on my actual server itself. I did this so that I could use the GUI to configure part of it, not to mention I was going to be monitoring the system anyway. Once installed, I enabled:
- All the preconfigured file and directory monitors
- The scripted metric inputs (pointing them to
system_metric) - A handful of other scripted inputs I wanted
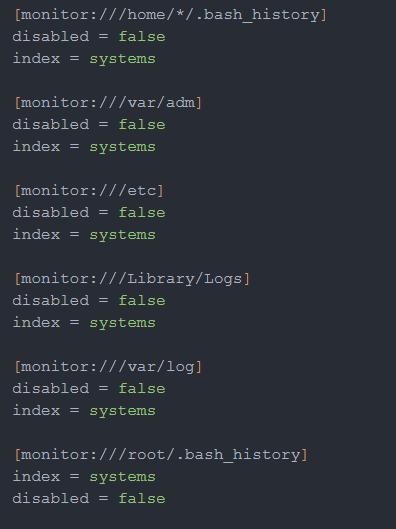
These changes generated an inputs.conf file in the app’s ./local folder. That’s great—but the setup wizard only lets you configure the index for metric inputs, not for logs or other inputs (don’t ask me why). So, I opened ./local/inputs.conf manually and added the index parameter for each input.
Configuring the Universal Forwarder
The first forwarder I’m setting up runs on a physical server I primarily use as a sensor (and the same one hosting my UniFi server I just wrote about). I want to manage the forwarder from my Splunk server via the new Agent Management console, so I only did minimal setup on the forwarder itself:
./splunk set default-hostname sensor
./splunk set servername sensor
./splunk set deploy-poll splunk.<domain>.home:8089
./splunk restart
Create a Base Forwarder App
I like to create a basic app that gets deployed to all forwarders. To save myself some typing, I used the built-in “Create App” function—it generates the app.conf and folder structure for you. Then I cracked it open in VSCode and added a ./local/outputs.conf:
[tcpout:indexers]
server = splunk.ward.home:9997
useACK = true
I copied the new app into $SPLUNK_HOME/etc/deployment-apps. Then, in Splunk 10’s Settings > Agent Management, I created a new server class called All Forwarders.
- Under Edit Forwarders, I set
*in the Include box so all forwarders are covered. - Under Applications, I added the
forwarder_baseapp and configured it to restart the forwarder after installation or updates.
Deploy Linux Add-On
Finally, I deployed the Splunk Add-on for Unix and Linux. I copied the app into deployment-apps, then went back into Agent Management:
- Created a server class called Linux
- Added the app to it (with restart enabled)
- Under Edit Hosts, I set Include =
*and Machine Type =linux-x86_64
After a few minutes, the forwarder pulled the app and started sending data. I verified it with a quick search:
index=systems | stats count by host
Sure enough, my sensor node showed up. Success!
This is a really helpful guide! The step-by-step process for setting up the Unix/Linux app and forwarders is clear and easy to follow. Great job!