
As I recently said one of the biggest reasons why both our Soldiers and even ourselves have such a hard time troubleshooting the network is because we don’t actually understand how our data is supposed to flow down to the very detailed level. We get the very broad ideas of where data is supposed to go but we often neglect to fully realize each of the very many steps involved in getting there.
I think most people who have spent more than a few days working with technical systems will admit that troubleshooting is much an art as a science. The OSI model teaches us that when we start to troubleshoot, we start at the bottom (layer 0) and work our way up. In my own personal experience, I have found that starting at layer 0 can work, but is by no means very efficient. Instead I (and I think most) tend to jump back and forth depending on the information that we have. In general though, I think most of us find that it is easiest to start troubleshooting at layer 3, and then using what we find to narrow down where we need to go down a layer or two.
Understanding Layer 3
By and large I personally think that most of us are much more comfortable with layer three than any other layer in the OSI model. We deal with it each and every day. We have a number of tools at our disposal which make it very easy for us to see if/when it’s working and just how the data is traveling. To start with though, we have to know just how things are supposed to work.
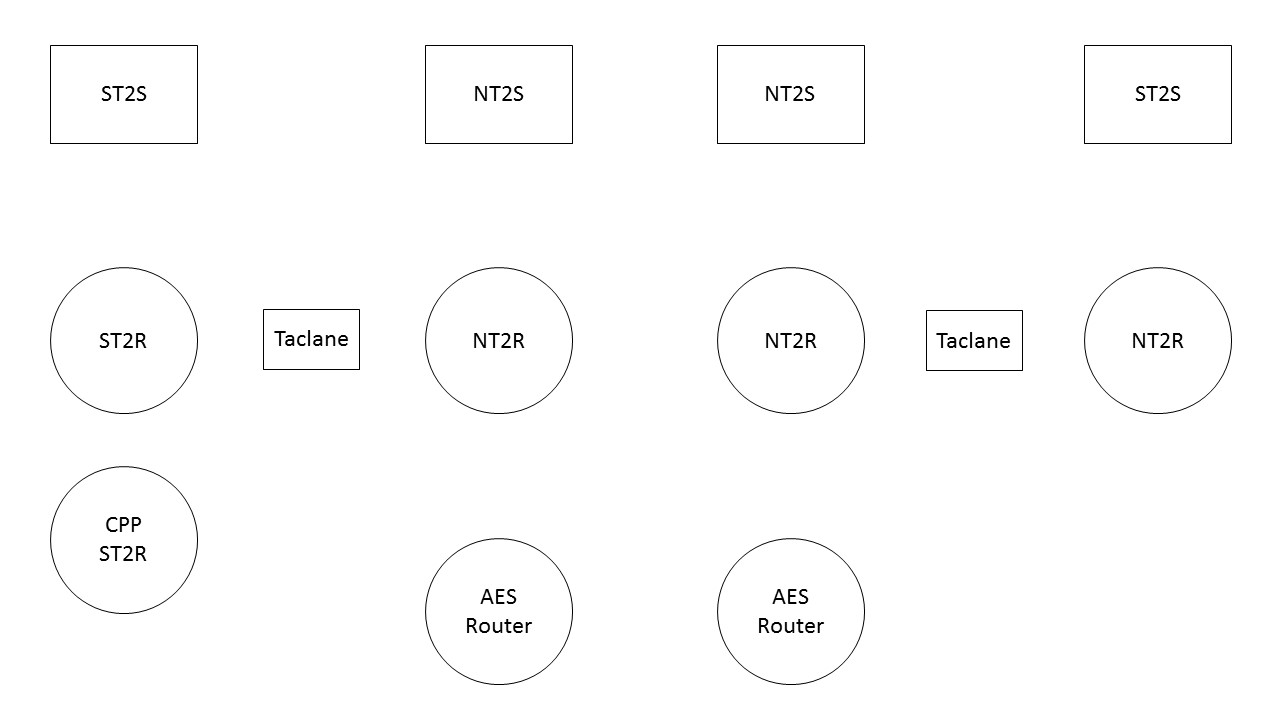
When I was a brigade net tech I would often have my Soldiers (both JNN/CPN operators and my NETOPS guys) work on an exercise that I had put together that laid out step by step the signal flow in a particular situation. Take for example I would start with something relatively easy problem like having them trace a voice packet as a user at the JNN calls a CPN operator using a NIPR phone. Once they worked through that, I would change it and have them do data flow to the RHN over FDMA. Eventually, I would take it up a notch and have them start to trace out SIPR data flow to include the encrypted flow over NIPR. The point is, they had to spend the time and draw out step by step by step what exactly the data packet was doing and explain why it was doing it.
I have attached a copy of the diagram that I used to use for this exercise. While I would post a few specific examples here, because of the details involved, it would definitely cross into the realm of FOUO so I have instead decided to post the actual detailed examples that I used in another post to my profile on MilSuite. I know it’s a pain in the ass and I hate doing it, but unfortunately, I don’t have a choice. Realize that the examples I post are based entirely on the configurations I had on my systems when I was a net tech (WIN-T Inc1A). Based on the various versions of JNN/CPN out there, your network may well have some differences so if there are, make the changes that you need to.
Troubleshooting Layer 3
Now that we have figured out how our packets are supposed to flow, we need to figure out what they are actually doing. There are two primary commands nearly everyone uses when it comes time to look at layer 3; ping and trace route. We use them both, even though they do essentially the same thing. For anyone who isn’t familiar with the differences, ping checks end to end connectivity between to devices and tells us if it is able to reach it. Traceroute does the exact same thing except in the process it attempts to tell us about each of the routers that it encounters as it travels along the process. I’m going to spend a few minutes talking about both of them.
Ping
As I said, ping simply tells us if we are able to reach an endpoint or not. The command on both a Windows box as well as Cisco is ping <destination address> (go figure huh?). That simple command sends several packets (four for windows and five for cisco) with a fairly small size (16 bytes for windows and 100 bytes for cisco) towards the destination. If it gets there, we get a reply message back telling us that it got there and gives us the number of router hops (TTL) and the amount of
time it took for those packets to get there (and back).
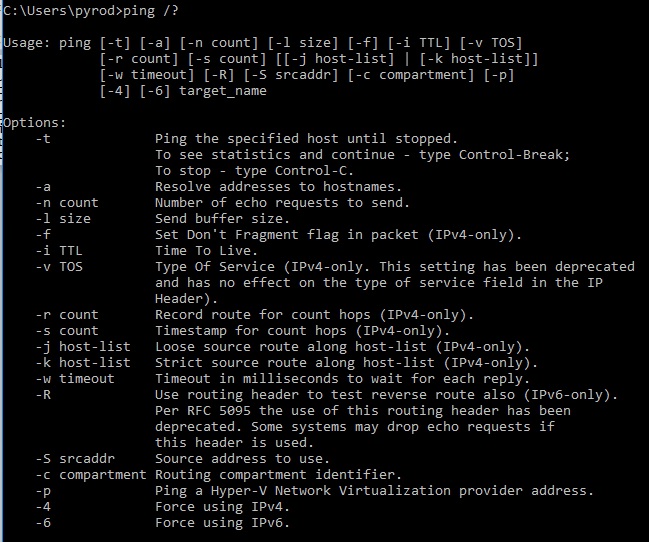
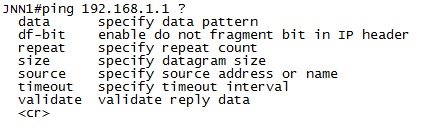
While that is great, there are a few additional things that we can do to make the ping command much more useful to us. With both Windows and Cisco we can make these adjustments using various options. In Windows, most options use a “-<letter>” after the command while Cisco just uses additional keywords after the command.
The first thing we can do is adjust the size of the ping packet. Being able to pass 100 bytes of data across the network is great, but I would hazard to guess that the majority of the actual packets going across the network are bigger than that. When I am truly trying to test to see how my network is working, I prefer to make my packets closer to 1Kb (1000 bytes) (Remember that the MTU across the network is 1500 bytes without taking into consideration the overhead from various tunnels and encryption). This is an easy adjustment to make simply by putting “-l 1000” in Windows or “size 1000” in Cisco.
Another important change to make to the default ping command when you are looking to test link reliability is the number of ping packets you are sending. Consider this. If I simply want to verify if a host is present on the other end one or two packets is perfectly fine; either it works or it doesn’t. But what if my goal is to see if a HCLOS link is running clean. I could send a few ping packets and get them all back without problems but that doesn’t mean that the link isn’t taking intermittent hits. Instead what I like to do is use the count command (-c in Windows or “repeat” in Cisco) and change the default four or five packets to 1000 or more. Yes, it takes a little bit longer to complete the command but we’re able to push a continuous stream of data across the link and see if any of those packets drop. Additionally with Windows we’re able to use the –t command which just starts a continuous series of pings until we stop it (using CTL + C).
Another option to consider is the –w in windows which adjusts the timeout of a packet. By default, a packet will timeout after 4 seconds (4000 milliseconds). For WIN-T Inc1 and most other systems this is more than fine but I have seen cases in WIN-T Inc2 where even that is not long enough and you may consider adjusting it to 6000 milliseconds. In Cisco, the same thing can be completed by adding the “timeout” keyword in the command string.
One final important option to talk about with the ping command is the –S (Windows) or “source” keyword (Cisco) which allows you to specify the source IP Address of the ping packet. While it is possible for our Windows machines to have multiple IP Addresses, it is not likely. Our routers and switches on the other hand almost always have multiple IP Addresses, and which one it uses as the source address for the ping packet can be very important (more on this in another article). When we ping from our routers and switches, it is important to specify what source address (you can specify either an actual address or an interface) to use so you know what exactly you’re testing.
Trace Route
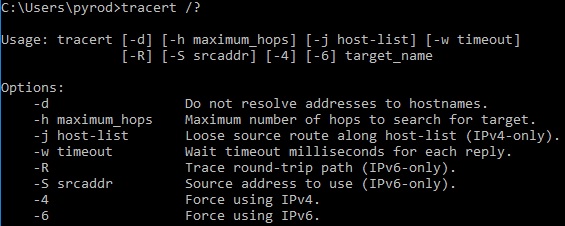
The trace route (tracert in Windows and traceroute in Cisco) command is similar to ping in that it test end to end connectivity between you and a distant location but different because it also shows you the path that the packet takes to get between those two locations. It does this by initially sending out packets with a time to live (TTL) of 1 which means they die at the first router. When the first router gets those packets, it sends back a message that includes among other things its IP address. Then additional packets with a TTL are sent out. This repeats until the destination is reached or a default limit of 30 hops has been reached (whichever comes first). This allows us to map out the entire path that the packet takes and determine if it is getting lost and where.
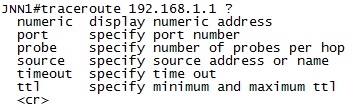
Like ping, trace route includes a few options that we can use to adjust it to meet our needs. Like ping –w in Windows and timeout in Cisco can be added to the command to adjust the timeout of each ping packet. Additionally Cisco allows you to use the “source” keyword to specify the source address of the ping packet although Windows only allows that for IPv6 pings. Also Windows includes the –d option which will keep the system from attempting to resolve the hostname for address (which speeds up the process).